I work with a team, the Ubuntu Foundations team, that has an interest in a lot of source packages and naturally bugs reported about those packages. To track all these packages we have setup a team in Launchpad, the foundations-bugs team, and subscribed them to the packages we care for and setup a mailing list to receive bug mail. Launchpad also provides us with a report that shows us some bug numbers, but this just shows information about where the bug tasks are as a whole. I wanted to find out which packages are receiving bug tasks right now and if that bug volume is abnormal for the package. (Some packages will always be receiving lots of bug reports.)
To this end I’ve created created a chart, using the packages the foundations-bugs team are subscribed to, that displays the quantity of bug tasks opened in the past 7 days and the past 14 days. Additionally, the bug tasks for a package are classified by their reporting method. (When a bug is reported by apport it is tagged differently depending on the type e.g. if it is a crash the bug is tagged apport-crash.) This information allows us to tell if a particular package is receiving a lot of crashes or package installation failures, which is more important than a lot of tasks tagged ubuntu-bug.
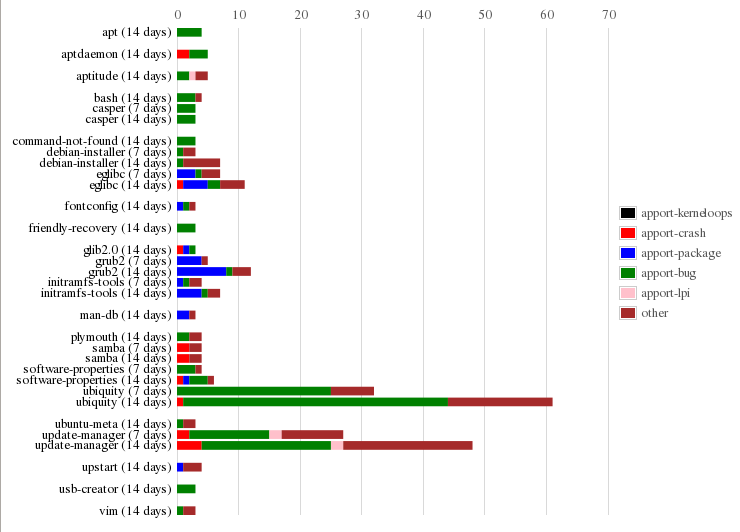
Looking at the above screenshot we can see that casper is having a spike in bug reporting activity as the bar length for the 7 day and the 14 day period are equal. This likely has something to do with the 10.04.4 testing that was going on but is worth investigating. grub2 also seems to have a large number of apport-package bugs which also should be investigated. The chart makes this really easy as each section of the bar takes you to a Launchpad search for all bug tasks about that package with the relevant tag. Additionally, the package name is also a link for all the bugs about the package.
I’ve made the same chart for the desktop, server and ubuntu-x-swat teams. If you have a team that is subscribed to Ubuntu packages I’m happy to make one for you too. Additionally, there are also charts for every package set in Precise so one of those might have a list of packages in which you are interested.